
SITS and HESA Data Management for UK Universities: A Power BI and Data Engineering Guide
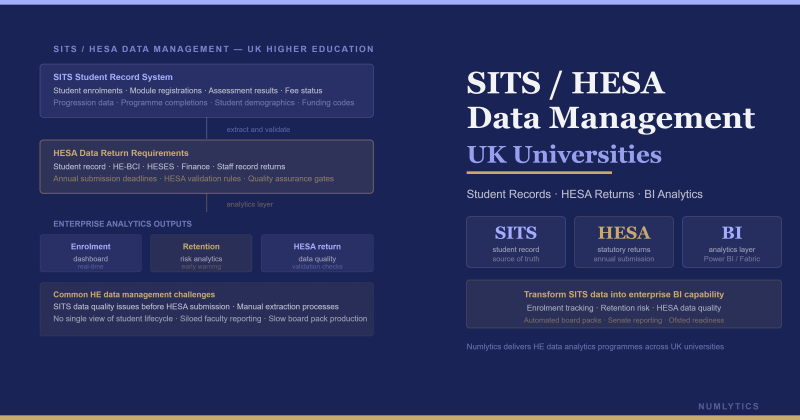
SITS and HESA data management for UK universities - transforming fragmented student data into governed, automated reporting that satisfies regulatory obligations and informs strategic decisions.
UK universities operate some of the most complex data environments in the public sector. A single student generates data across SITS:Vision (the dominant student records system), UCAS (admissions), the university's library, VLE, finance system, accommodation platform, and multiple specialist departmental systems. Each of these systems was designed to manage its own operational domain. None of them was designed to answer the cross-system analytical questions that a Vice Chancellor, a Head of Planning, or a Registrar needs answered: How does our predicted intake compare to confirmed acceptances by subject area? What is our continuation rate by widening participation cohort? Are we on track to meet our Access and Participation Plan commitments to OfS? These questions require a governed analytical layer that sits above the operational systems and for most UK universities, building that layer correctly is the unresolved challenge that SITS HESA data management work addresses.
The UK Higher Education Data Challenge
The data challenge facing UK university planning, registry, and student experience teams is not a shortage of data. It is a combination of three structural problems that compound each other.
Data quality in SITS. SITS:Vision is the record of truth for student enrolments, programme structures, assessment outcomes, and award classifications. But the quality of SITS data depends entirely on the processes used to enter and maintain it, and in most universities, those processes have been built up incrementally over years, with different departments and different staff cohorts applying different conventions. Module codes that follow inconsistent naming patterns, programme records that are ambiguous about part-time vs full-time status, award classification fields that have been used differently across different academic years - these are not SITS problems, they are data governance problems that manifest in SITS, and they cascade into every downstream analytical system that reads from SITS.
HESA return preparation. The Higher Education Statistics Agency requires UK universities to submit annual and monthly data returns covering student enrolments, qualifications awarded, staff records, and finance. Preparing these returns involves extracting data from SITS (and other systems), mapping it to HESA's field definitions and coding frames, applying HESA's data quality validation rules, resolving the validation errors, and submitting within HESA's annual deadlines. For most universities, this process is significantly more manual and more error-prone — than it needs to be.
Analytical accessibility. Even where SITS data quality is acceptable, making that data accessible to non-technical analysts and academic managers through a governed, maintained analytical layer requires data engineering capability that many university planning and data teams do not have in-house. The result is that analytical questions that should be answered in seconds take days involving data exports from SITS, manual manipulation in Excel, and the production of point-in-time reports that are outdated before they are distributed.
"HESA validation errors are data governance failures made visible. Every SITS field that returns a validation error has a governance root cause an inconsistent process, an undefined standard, or a system configuration that has drifted from its original intent. Fixing the return is one week's work. Fixing the governance is what stops next year's return from having the same errors."
Understanding SITS:Vision and Its Analytics Limitations
SITS:Vision (developed by Tribal Group) is a relational database system designed around a student record schema that covers the full academic lifecycle: enquiry, application, enrolment, assessment, progression, award, and alumni. Its underlying database is SQL Server, which means the data is technically accessible via standard SQL queries, but SITS's schema is complex, denormalised in places, and uses coding frame conventions that require careful mapping before the data can be used analytically.
SITS includes a built-in reporting module, but its report development requires specialist SITS knowledge (typically SITS-specific query language or Crystal Reports development) and is limited to SITS data only - it cannot join SITS data with UCAS feeds, Finance system exports, or any other external system. This means SITS's built-in reporting is useful for operational registry queries but insufficient for the cross-system analytical requirements that senior leaders and planning teams need.
For Power BI integration, SITS data is typically accessed through one of three routes: direct SQL connection to the SITS SQL Server database (read-only, via a reporting database replica where available), SITS's OData API endpoints (available in more recent SITS versions), or scheduled extract files (CSV or XML exports from SITS's scheduled task engine). Each route has different latency and governance implications, and the appropriate choice depends on whether real-time or daily-refresh analytics is the target.
HESA Returns: From Manual Extraction to Automated Pipeline
HESA's Student return (the C11001 collection) is the most significant annual data obligation for most UK universities covering every enrolled student's demographic, programme, module, and outcome data against HESA's precise coding frame. The return involves hundreds of individual fields, each with specific HESA-defined valid values and cross-field validation rules. Validation errors in the return can range from minor warnings that require commentary to fatal errors that block submission until resolved.
The manual approach to HESA return preparation typically involves a registry or data team running SITS extraction queries, exporting to CSV, importing into HESA's data submission portal or a local validation tool, reviewing the error log, tracing errors back to SITS records, updating SITS, and re-extracting. This cycle repeats until all fatal errors are resolved and the error count falls within acceptable thresholds for the submission.
An automated pipeline approach changes this fundamentally. A data pipeline built on Azure Data Factory, Microsoft Fabric Data Pipeline, or Power BI Dataflows extracts the relevant SITS data on a scheduled basis, applies the HESA coding frame mappings, runs HESA's published validation rules as transformation logic, and surfaces the errors in a Power BI dashboard that registry staff can review and triage daily throughout the return cycle rather than in a concentrated end-of-period effort. The Power BI validation dashboard shows current error counts by error type, trend of errors over time (reducing as corrections are applied), and a prioritised list of records requiring attention with links to the relevant SITS screens for correction.
This approach converts the HESA return from an annual crisis into a continuous data quality programme errors are identified and resolved throughout the year rather than accumulated and addressed under deadline pressure.
UCAS Integration: Connecting Admissions Data to Operational Analytics
UCAS data - application volumes, offer rates, acceptance rates, predicted grades, deferred entry decisions is the forward indicator data that university planning teams need to forecast intake alongside SITS's confirmed enrolment data. UCAS provides several data feeds to universities, including the Daily Offers and Acceptances System (DASS) data and the End of Cycle data products, each available through secure file downloads or API access.
Integrating UCAS data with SITS data in Power BI requires matching applicant records across the two systems, UCAS uses its own applicant identifier (the Personal ID) which may or may not be reliably captured in SITS, depending on the university's admissions workflow. Where the join key is reliable, the combined analytical capability is substantial: a Power BI dashboard showing applications, offers, firm acceptances, and confirmed enrolments in a single funnel view by subject, domicile, widening participation flag, and entry qualification profile is the core admissions analytics product that Head of Admissions teams consistently request and that no single source system can produce independently.
OfS Compliance and Data Governance Requirements
The Office for Students (OfS) requires registered providers to meet data quality conditions as part of ongoing registration, specifically around the accuracy and completeness of data submitted to HESA and the reliability of the data underpinning Access and Participation Plans (APPs). Universities that submit HESA data with systematic errors particularly errors related to widening participation flags, continuation rates, or degree outcome classifications risk OfS intervention on data quality grounds.
The OfS's focus on APP metrics - specifically the continuation, completion, and progression outcomes for students from underrepresented groups creates a direct requirement for universities to monitor these metrics in-year, before the data is submitted to HESA and the outcomes are published in league tables and OfS dashboards. A Power BI dashboard that tracks APP metric trajectories against the university's own targets throughout the academic year rather than only at the point of HESA submission enables proactive intervention: identifying cohorts at risk of poor outcomes early enough to act, rather than retrospectively reporting poor outcomes after the fact.
Building the Data Engineering Pipeline: SITS to Power BI
The data engineering pipeline for UK university analytics follows the same Medallion pattern used across other enterprise data integrations, adapted for the specific characteristics of SITS data and the HESA coding frame.
The Bronze layer holds the raw SITS extracts - the student programme attempt (SPA) records, the student module attempt (SMA) records, the student financial support records, and the associated coding frame lookup tables (course types, award types, qualification levels, mode of study codes). These are extracted on a daily scheduled basis and preserved as-extracted, with extraction timestamps, so that any data quality issue can be traced to the source record as it existed at a specific point in time.
The Silver layer applies the HESA coding frame mappings - translating SITS's internal codes to HESA's coding frame values for mode of study, qualification level, subject of study (using JACS or HECoS subject codes), domicile, and fee liability status. It also applies the widening participation derivations calculating the POLAR4 or IMD quintile groupings, the declared disability categories, the care leaver flags, and the mature student definitions that OfS APP metrics depend on.
The Gold layer presents the analytics-ready fact and dimension tables: a student enrolment fact table, a module assessment fact table, an award completions fact table, and the associated student, programme, academic year, and date dimensions. Power BI semantic models read from the Gold layer, delivering consistent, governed metrics to reporting dashboards for registry, planning, academic management, and executive audiences.
Key Dashboard Areas for UK University Analytics
A comprehensive UK university analytics programme built on SITS and HESA data serves four primary dashboard audiences, each with different analytical requirements but all drawing from the same governed Silver and Gold data layers.
Admissions and Intake Forecasting. Real-time intake funnel from UCAS applications through to confirmed enrolments, with year-on-year and target comparisons by subject area, level of study (UG, PGT, PGR), domicile (home, EU, international), and clearing status. Updated daily during the admissions cycle from UCAS DASS feeds and SITS confirmed enrolments.
Student Experience and Continuation. Continuation rates by cohort entry year, programme, and widening participation characteristics, tracked against the university's APP targets. Module pass rates, grade distributions, and assessment outcomes by school and department. Attendance and engagement indicators from the VLE where available.
HESA Validation and Data Quality. Ongoing monitoring of HESA validation error counts and types throughout the academic year, with a prioritised error triage view for registry staff. Trend charts showing error reduction over time. Pre-submission completeness checks against HESA's expected record counts.
OfS APP Metrics. Dashboards tracking the specific continuation, completion, and progression metrics included in the university's Access and Participation Plan, segmented by the OfS's defined underrepresented student groups (POLAR4 Q1-Q2, declared disability, care leaver status, mature entry), updated at census point dates and at end of year.
The Numlytics Delivery Model: Dashboards Live in 3–6 Weeks
Numlytics delivers the SITS and HESA data engineering programme for UK universities in a structured, time-bounded delivery model. The programme begins with a data audit a structured review of the university's current SITS data quality, HESA validation error patterns, and existing reporting infrastructure, conducted in the first week. This audit identifies the highest-priority data quality issues, the HESA coding frame mappings required, and the specific dashboard requirements of the planning, registry, and executive audiences.
The data engineering pipeline - Bronze extraction from SITS, Silver HESA mapping and widening participation derivations, Gold analytics-ready tables is built and validated in weeks two and three, using Azure Data Factory or Microsoft Fabric pipelines connected to the university's SITS SQL Server reporting replica. Power BI semantic models and the first dashboard set typically the HESA validation dashboard and the admissions intake funnel are built and delivered in weeks four and five. The full dashboard set, including student experience and APP metrics, is live by week six.
The 3–6 week timeline is achievable because Numlytics brings pre-built SITS extraction patterns, HESA coding frame mapping templates, and Power BI dashboard templates for the standard UK HE analytics use cases reducing the bespoke development required for each university to the configuration specific to that institution's SITS schema version, departmental structure, and APP commitments.
Data Integration Approach Comparison
| Approach | HESA Automation | UCAS Integration | Real-Time Monitoring | Time to First Dashboard |
|---|---|---|---|---|
| Manual SITS extracts to Excel | Manual — point-in-time only | Separate manual process | None — periodic only | Ad hoc — no sustained analytics |
| SITS built-in reporting | Limited — SITS data only | Not possible | Operational queries only | Immediate but constrained |
| Direct SQL to Power BI (no staging) | Partial — no coding frame mapping | Requires manual join design | Daily refresh possible | 4–8 weeks |
| Medallion pipeline (ADF/Fabric) to Power BI | Full — automated coding frame mapping and validation | Integrated via Bronze layer | Daily or real-time refresh | 3–6 weeks with Numlytics templates |
- SITS data quality issues are governance problems - inconsistent data entry processes and undefined coding standards that manifest in HESA validation errors and cascade into every downstream analytical system.
- Automated HESA return pipelines that apply HESA coding frame mappings and validation rules continuously throughout the year convert the annual submission crisis into a daily data quality programme.
- UCAS integration with SITS is the data foundation for admissions funnel analytics connecting application volumes, offers, and acceptances to confirmed enrolments in a single governed view.
- OfS APP compliance monitoring requires in-year tracking of continuation, completion, and progression metrics by widening participation cohort data that no individual source system can produce without a governed analytical layer.
- The Medallion pipeline architecture (Bronze SITS extraction → Silver HESA mapping and WP derivations → Gold Power BI semantic model) is the right foundation for UK university analytics at any scale.
- Numlytics delivers the first Power BI dashboards for UK universities in 3–6 weeks by combining pre-built SITS extraction patterns, HESA coding frame mapping templates, and standard UK HE dashboard structures with university-specific configuration.
Next Steps for UK University Data Leaders
For UK university planning directors, registrars, and heads of data who are managing SITS data quality issues, struggling with HESA return preparation, or building the business case for a proper analytical infrastructure, the starting point is a structured data audit that surfaces the specific issues in the current environment and quantifies the effort required to address them.
Numlytics has delivered SITS and HESA data engineering programmes for UK universities and has the templates, connectors, and coding frame mapping libraries to move from audit to live Power BI dashboards within the 3–6 week timeframe described above. If your university is preparing for the next HESA return cycle, reviewing its OfS APP commitments, or building a strategic case for an institutional data platform, speak with a Numlytics data consultant today. We bring the HE sector knowledge and technical delivery capability to make the programme work, not just in principle, but in practice, within a timeline and budget that a university planning team can commit to.
For the data engineering platform capabilities that underpin this work, see our posts on enterprise data integration with Microsoft Fabric and the Power Automate automation patterns that can drive HESA error notifications and registry workflows alongside the analytical dashboards.