
AI Analytics Power BI: From Descriptive Reporting to Predictive Intelligence
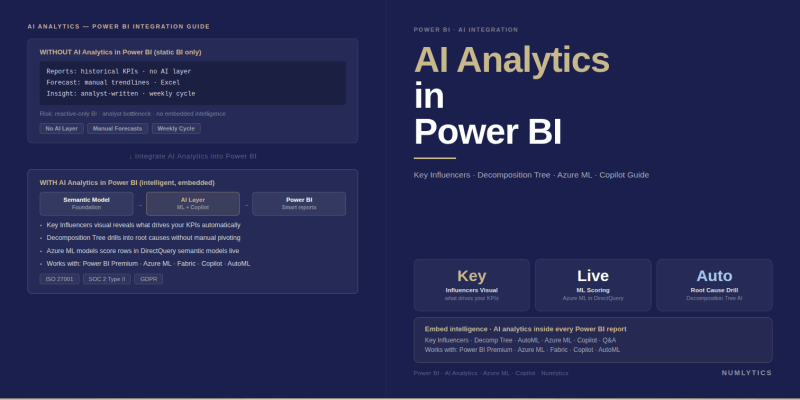
AI analytics Power BI - combining native AI visuals, Azure ML integration, and Copilot for enterprise predictive intelligence.
Power BI estates that deliver reliable descriptive reporting have built the correct foundation. But descriptive analytics has a ceiling, and most executive teams have hit it. When leadership asks whether margin compression will continue or which customer segment is most likely to churn before renewal, historical charts cannot answer. AI analytics Power BI adds predictive intelligence on top of the data infrastructure organisations already own without requiring a platform replacement or a parallel data environment. The AI analytics Power BI capabilities covered here are available today through native Power BI features, Azure AI integration, and Microsoft Copilot.
The Analytics Ceiling Most Power BI Estates Have Already Hit
Most enterprise Power BI deployments operate at the descriptive tier: surfacing what happened across revenue, operations, headcount, and margin. These deployments are valuable often representing years of semantic model development and governance investment. Their limitation is structural, not a design flaw.
When a CFO asks why a division underperformed, descriptive analytics can surface the outcome but cannot isolate the causal driver with statistical precision. When a supply chain director needs to know which supplier delays will cascade into next month's production shortfalls, trend lines are insufficient. The gap between what a standard Power BI estate currently delivers and what AI analytics Power BI can deliver is measurable and closing it rarely requires the infrastructure overhaul executives assume it will.
"The most durable AI analytics Power BI investments extend what the business already trusts - they do not introduce a parallel data environment outside the governed estate."
Three Tiers of AI Analytics Power BI Capabilities
Microsoft structures AI analytics Power BI across three adoption tiers: native AI visuals in Power BI Desktop at no additional licence cost; Azure AI service integrations through Power Query and dataflows; and Copilot capabilities embedded across report creation and Q&A. Each tier compounds on the previous. Understanding where each AI analytics Power BI tier applies allows data leaders to build a commercially justifiable adoption roadmap without over-investing in advanced infrastructure before the organisational foundations are in place.
Tier One Native AI Visuals in Power BI Desktop
Power BI Desktop includes three AI visuals that require no additional licencing and no data science capability: the Key Influencers visual, the Decomposition Tree, and Smart Narratives. All three sit on top of the existing semantic model without schema modification, making them immediately deployable in any governed Power BI environment.
The Key Influencers visual identifies which variables statistically correlate with a chosen outcome churn drivers, margin contributors, sales cycle predictors. The Decomposition Tree lets executives break any metric into contributing dimensions dynamically without pre-built hierarchies. Smart Narratives generate plain-language visual summaries automatically, reducing analyst time spent writing board pack commentary. For AI analytics Power BI at Tier One, implementation cost is low and workflow impact is immediate.
Azure AI Integration - When Native Visuals Are Not Enough
When predictive requirements demand custom modelling demand forecasting, fraud risk scoring, customer lifetime value native visuals reach their ceiling. The Azure AI path extends AI analytics Power BI into custom machine learning territory without requiring analysts to manage infrastructure outside Power BI. Every AI analytics Power BI deployment that reaches production-level forecasting does so through this Azure integration layer. The Azure Machine Learning integration allows trained predictive models to be invoked directly inside Power BI dataflows, publishing predictions as governed, auditable columns in the semantic model.
Azure Machine Learning in Power BI Dataflows
Once a trained model is registered in Azure ML and the workspace is granted access, data engineers invoke predictions as a Power Query transformation appending a predicted value, probability score, or classification as a new dataset column. That column becomes a standard semantic model field: visible to every connected report, refreshable on the same pipeline schedule, and auditable like any calculated measure. This architecture keeps AI analytics Power BI outputs inside the governed data estate rather than creating shadow analytics that bypass lineage and ownership controls. Organisations operating AI and machine learning programmes at scale consistently cite this governed integration pattern as the differentiator between pilots that reach production and those that stall.
Copilot in Power BI - The Executive Productivity Layer
Copilot in Power BI is the most visible expression of Microsoft's AI analytics Power BI strategy and the capability with the most direct impact on executive self-service. For report developers, Copilot generates report pages, writes DAX measures, and produces narrative summaries from natural language prompts compressing hours into minutes. For report consumers, Copilot's Q&A interface lets business users query the semantic model in plain language without navigating pre-built reports. A CFO can ask "show me last quarter's margin by division versus budget" and receive a rendered visual without waiting for an analyst. This is the executive self-service outcome data leaders have targeted for years - AI analytics Power BI through Copilot delivers it at enterprise scale.
Two constraints govern deployment. Copilot requires Power BI Premium Per User, Premium Per Capacity, or Microsoft Fabric capacity. And output quality scales directly with semantic model quality measures must be defined, hierarchies correct, and field descriptions present for Copilot to return answers executives will trust, which is why Power BI semantic model consulting is the correct prerequisite before Copilot rollout.
AI Analytics Power BI vs. Traditional Reporting
The table below translates the capability difference that AI analytics Power BI represents relative to standard reporting into the workflow and commercial terms that resonate with CFOs and CDOs evaluating where to invest next.
| Capability | Traditional Power BI Reporting | AI Analytics Power BI |
|---|---|---|
| Decision support type | Descriptive — what happened | Predictive and prescriptive — what will happen and why |
| Driver analysis | Manual — analyst builds and maintains | Automated — Key Influencers on the existing semantic model |
| Forecast capability | Not available natively | Azure ML model output as a governed dataflow column |
| Executive self-service | Limited to pre-built report navigation | Natural language Q&A via Copilot without report navigation |
| Analyst time-per cycle | High — commentary, ad hoc queries, one-off analyses | Reduced — Smart Narratives and Copilot absorb routine output |
| Licencing requirement | Power BI Pro or Premium | Premium Per User, Premium Per Capacity, or Microsoft Fabric |
Measuring Return on AI Analytics Power BI Investment
The most common mistake when justifying AI analytics Power BI investment is measuring the capability rather than the workflow change it enables. The return from the Key Influencers visual is not algorithm sophistication - it is analyst hours reclaimed per reporting cycle because product managers can run driver analysis independently without submitting BI requests. The return from Azure ML integration is not model accuracy in isolation - it is procurement cycle time reduced when buyers work from a forecast column rather than a manually assembled spreadsheet.
Three baseline metrics worth establishing before any AI analytics Power BI deployment: median BI request resolution time, analyst hours per reporting cycle, and the number of ad hoc executive data questions per week that require analyst involvement. Measuring these before any AI analytics Power BI deployment is what makes the after-state commercially legible to a CFO and protects the investment case at board level.
- AI analytics Power BI operates across three tiers — native AI visuals, Azure ML integration, and Copilot — each with distinct licencing and implementation requirements that enable incremental adoption.
- Key Influencers, Decomposition Tree, and Smart Narratives are available in Power BI Desktop at no additional licence cost and deploy without modifying the existing semantic model.
- Azure Machine Learning integration publishes model predictions as governed, auditable columns in Power BI dataflows — keeping AI outputs inside the data governance framework.
- Copilot requires Premium or Fabric capacity, and its output quality scales directly with the documentation and correctness of the underlying semantic model.
- ROI from AI analytics Power BI is best measured at the workflow level — analyst hours reclaimed, cycle times reduced, executive self-service enabled — not at the feature level.
- A well-governed semantic model with documented measures, correct hierarchies, and complete field descriptions is the prerequisite for every AI capability in Power BI.
Next Steps for Your AI Analytics Roadmap
Organisations that extract the most value from AI analytics Power BI sequence adoption against specific commercial problems rather than activating every capability at once. The practical starting point is a semantic model audit. Every AI capability in Power BI returns results only as reliable as the data and business logic beneath them undefined measures, inconsistent hierarchies, or undocumented rules will undermine AI output, and executive trust will not survive its first inconsistency at a board setting.
Once the foundation is confirmed, identify two or three decision workflows where AI analytics Power BI can reduce cycle time measurably: demand forecasting for procurement, churn scoring for customer success, or variance analysis for finance. Pairing that with a Power BI governance programme ensures AI outputs are version-controlled, trustworthy, and scalable across business units as the programme grows.
To discuss how AI analytics Power BI fits your organisation's reporting roadmap and where to sequence adoption for maximum commercial return, speak with a certified analytics consultant at Numlytics. We partner with enterprise data teams across the US, UK, Australia, and UAE - from Power BI semantic model consulting through to full AI and machine learning integration. For the data platform foundation that underpins AI-ready analytics, our guide on medallion architecture in Azure Synapse Analytics explains how a layered data platform makes predictive intelligence at enterprise scale both achievable and governable.