
From Data Analytics to AI in Power BI: A Practical Roadmap for Enterprise Leaders
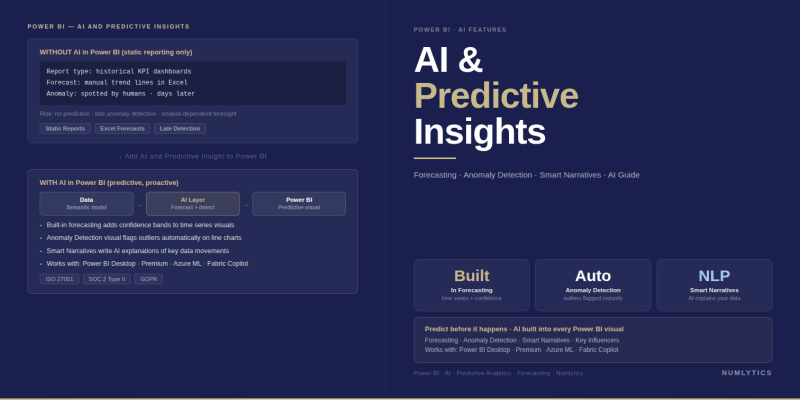
The analytics maturity journey from descriptive Power BI reporting to AI-driven predictive and prescriptive intelligence at enterprise scale.
Most enterprise Power BI implementations are performing well below their analytical ceiling. The reports are built, the dashboards are published, the refresh schedules are running but the organisation is still primarily asking what happened last month rather than what is likely to happen next quarter, or which action will produce the best outcome given current conditions. The shift from descriptive reporting to genuine AI in Power BI data analytics is not primarily a technology decision. It is a maturity decision and it requires a structured roadmap rather than a collection of isolated experiments.
The Gap Between Reporting and Decision Intelligence
Descriptive analytics what most Power BI estates are built on answers the question of what happened. It is valuable. It is necessary. But it is also the lowest rung of the analytical value ladder. The CFO who can see last quarter's margin by product line has useful information, but the CFO who can see a model-driven forecast of where margin is likely to land at year-end with confidence intervals and the key drivers behind the projection has decision intelligence. Those are fundamentally different capabilities, and the gap between them is not closed by adding more visuals to an existing report.
The good news for organisations already invested in Power BI is that Microsoft has embedded meaningful AI capabilities natively into the platform. The path from descriptive to predictive does not require migrating away from Power BI or standing up a separate data science infrastructure. It requires understanding which AI capabilities are available, what data preconditions they require, and how to sequence their introduction into a production analytics programme.
"Descriptive analytics tells you what happened. Predictive analytics tells you what is likely to happen. Prescriptive analytics tells you what to do about it. Most enterprise Power BI estates are parked at stage one - not because stage two is unreachable, but because no one has mapped the road."
The Four Stages of Analytics Maturity
Understanding where an organisation sits on the analytics maturity curve is the prerequisite for any meaningful AI investment. Each stage builds on the one before it, and organisations that attempt to skip stages deploying machine learning models on top of inconsistent, ungoverned data consistently encounter the same failure: the AI produces outputs that no executive will trust, because the input data does not earn trust.
Stage 1 Descriptive: Historical reporting. What happened? Power BI dashboards, KPI tracking, period-over-period comparisons. This is where the majority of enterprise Power BI deployments operate. The analytical value is real but entirely backward-looking.
Stage 2 Diagnostic: Root cause analysis. Why did it happen? Drill-down navigation, decomposition trees, driver analysis, and anomaly detection. Power BI's built-in AI visuals - Key Influencers, Decomposition Tree, and Smart Narratives operate at this stage. They surface the factors behind observed outcomes without requiring any custom model development.
Stage 3 Predictive: Forward-looking forecasts. What is likely to happen? Time series forecasting built into Power BI's analytics pane, AutoML models integrated via Azure Machine Learning or Microsoft Fabric, and custom Python or R visuals embedded in reports. This stage requires clean historical data, a certified date hierarchy, and sufficient historical volume to train reliable models.
Stage 4 Prescriptive: Recommended actions. What should we do? Decision optimisation models, scenario planning tools, and AI-generated recommendations surfaced directly in executive dashboards. This is the frontier of AI in Power BI data analytics and requires the full stack clean data, governed models, integrated AI services, and the organisational willingness to act on model-generated recommendations.
What AI Capabilities Are Actually Available in Power BI Today
The practical starting point for most organisations is the AI analytical features that Power BI already ships with no custom development required, no external API calls, no Azure subscription changes needed.
The Key Influencers visual uses machine learning to identify which factors in a dataset are statistically associated with changes in a target metric. For a sales dataset, it might surface that deals with a contract term above 24 months, initiated through a specific channel, and in a particular region are disproportionately likely to convert above target. This is diagnostic AI: it does not require a data scientist, it runs on the existing semantic model, and it produces results that a non-technical executive can act on directly.
The Decomposition Tree visual allows users to interactively explore which dimensions contribute most to a metric value drilling from an aggregate figure through progressively more granular splits to identify the combination of factors that explains the most variance. Unlike a pre-built drill-down hierarchy, the Decomposition Tree can use an AI-assisted split mode that identifies the highest-value dimension to explore next, rather than requiring the user to specify the exploration path manually.
Anomaly detection on line charts automatically identifies data points that deviate from the expected range based on the historical pattern of the series, surfaces those anomalies as markers, and provides an explanation of which factors in the model are most associated with the deviation. This is automated diagnostic intelligence applied to time series data a capability that previously required bespoke statistical monitoring.
AutoML and Azure Machine Learning Integration
For organisations ready to move beyond Power BI's built-in AI visuals into genuine predictive model deployment, the integration between Power BI Dataflows, Azure Machine Learning, and Microsoft Fabric provides a governed path to production ML without requiring a dedicated data science team for every model.
AutoML within Power BI Dataflows available to Power BI Premium and Fabric capacity users allows analysts to train binary classification, regression, and time series forecasting models directly against Dataflow datasets, with automated feature engineering and model selection. The resulting model is published as a Dataflow output and becomes consumable by any report or dataset in the workspace as a scored column effectively embedding a predictive model into the standard data refresh pipeline.
The Azure Machine Learning integration extends this further: models trained and validated by data scientists in Azure ML can be registered and invoked directly from Power BI Dataflows, making the full Azure ML model catalogue available to Power BI report authors without requiring them to understand the underlying model architecture. This separation data scientists own the model quality, report authors consume the model outputs is the governance pattern that allows AI in Power BI data analytics to scale beyond individual experiments into a production-grade capability.
Cognitive Services Integration
Power BI Dataflows also provide native access to Azure Cognitive Services capabilities sentiment analysis, key phrase extraction, language detection, and image tagging through pre-built Power Query functions. For organisations working with unstructured text data (customer feedback, support tickets, survey responses), Cognitive Services integration enables structured analytical treatment of data that would otherwise require a separate NLP pipeline before it could appear in a Power BI report. A customer satisfaction dataset enriched with sentiment scores and key phrase categories becomes a fully analytical asset rather than a qualitative source that lives outside the reporting estate.
Power BI Copilot and Natural Language Analytics
Power BI Copilot, available within Microsoft Fabric capacity workspaces, represents the conversational layer of AI in Power BI data analytics. Report consumers can ask natural language questions "show me which regions missed target last quarter and by how much" and Copilot generates the appropriate visual or analytical response directly, without requiring the user to navigate a pre-built report structure. For executive audiences who need fast answers to specific questions rather than a guided report experience, this capability reduces the latency between a business question and a data-grounded response.
Report authors can also use Copilot to accelerate report creation: describing a desired visual or analysis in natural language and having Copilot generate the DAX measure or report page layout as a starting point. This is not a replacement for skilled report development Copilot-generated DAX requires review and validation, but it meaningfully reduces the time from analytical requirement to first draft for standard report patterns.
Data Readiness: The Non-Negotiable Precondition for AI
None of the capabilities above produce reliable outputs on unreliable data. This is the point where many enterprise AI in analytics initiatives stall: an organisation deploys a machine learning model, the model produces confusing or contradictory outputs, and confidence in the analytical programme collapses. The root cause is almost always data quality rather than model design inconsistently defined dimensions, incomplete historical records, ungoverned metric definitions that allow different business units to report the same KPI differently.
The data readiness preconditions for predictive analytics specifically are: a certified date table with a complete, gap-free calendar, consistent entity keys across source systems, sufficient historical volume for the metric being predicted (typically a minimum of two full annual cycles for any metric with seasonal patterns), and a governed semantic model with certified measure definitions. Organisations that have invested in Power BI governance infrastructure before pursuing AI integration have dramatically shorter paths to production model deployment because the data foundation is already validated.
Analytics Maturity Comparison: What Changes at Each Stage
| Stage | Primary Question Answered | Power BI Capability | Data Precondition | Business Value |
|---|---|---|---|---|
| Descriptive | What happened? | Dashboards,KPI cards,standard visuals | Clean,refreshed datasets | Operational visibility and accountability |
| Diagnostic | Why did it happen? | Key Influencers, Decomposition Tree, Anomaly Detection | Dimensional model with consistent attributes | Root cause identification without manual analysis |
| Predictive | What is likely to happen? | Forecastanalytics,AutoML,Azure ML integration | Certified date table, 2+ years history, governed metrics | Proactive decision-making and resource planning |
| Prescriptive | What should we do? | Copilot,scenario models,optimisation outputs | Full governed data estate, validated ML pipeline | AI-recommended actions embedded in executive workflow |
- Most enterprise Power BI estates operate at Stage 1 (descriptive) - the gap to predictive AI is bridgeable without leaving the Power BI ecosystem, but it requires a sequenced roadmap.
- Power BI's built-in AI visuals - Key Influencers, Decomposition Tree, and Anomaly Detection deliver diagnostic intelligence with no custom development and are available to any Power BI Pro or Premium user today.
- AutoML within Power BI Dataflows enables binary classification, regression, and time series forecasting models trained directly against governed datasets without requiring a dedicated data science team per model.
- Power BI Copilot provides natural language query capability for report consumers and accelerates report authoring available within Microsoft Fabric capacity workspaces.
- Data readiness is the single most common bottleneck for AI in Power BI data analytics: inconsistent dimensions, incomplete history, and ungoverned metric definitions produce unreliable model outputs regardless of algorithm quality.
- Organisations with mature Power BI governance infrastructure have significantly shorter paths to production AI deployment because the data foundation that AI requires is already in place.
Building Your Roadmap from Analytics to AI
The practical starting point for most organisations is an honest assessment of current analytics maturity against the four-stage framework above not aspirationally, but based on actual production report usage. Organisations that believe they are at Stage 2 but whose executives primarily consume Stage 1 outputs have a perception gap that will undermine any AI initiative built on top of it.
Once the honest baseline is established, the roadmap follows a clear sequence: deploy the built-in diagnostic AI visuals on the highest-value existing reports first. Validate that business users find them useful and trustworthy. Address any data quality issues that the diagnostic visuals surface. Then move to AutoML forecasting on the metrics where predictive accuracy has the highest business value - revenue, demand, churn - before building out the full prescriptive layer.
This sequenced approach produces compounding returns: each stage validates and strengthens the data foundation that the next stage depends on. It also builds organisational confidence in AI-generated outputs progressively, which is the precondition for executives to act on prescriptive recommendations rather than treating them as curiosities.
If your organisation is ready to map its specific journey from descriptive Power BI reporting to AI in Power BI data analytics, speak with a certified consultant at Numlytics. We work with enterprise analytics leaders across the US, UK, Australia, and UAE to build the data foundations and AI integration roadmaps that make predictive intelligence operational rather than aspirational. For teams managing the governance infrastructure that underpins this journey, explore how Numlytics' Power BI Governance Platform accelerates the data readiness preconditions for AI adoption.
For a related deep-dive into the ML model tracking capabilities available within Microsoft Fabric - a key component of a production AI analytics architecture, see our post on ML model tracking in Microsoft Fabric Notebooks.